Projections of Global Climate Change
Key information
The Intergovernmental Panel on Climate Change (IPCC) is the leading international body for the assessment of climate change. The IPCC was established in 1988 by the World Meteorological Organisation (WMO) to provide the world with a clear scientific view on the current state of knowledge in climate change and its potential environmental and socio-economic impacts.
To date, the IPCC has published six assessment reports. These provide the scientific basis on which governments at all levels develop climate-related policies as well as being the basis for negotiations at the UN Climate Conference - The United Nations Framework on Climate Change (UNFCCC).
- The Sixth Assessment Report of the IPCC concluded that the global warming of the last 50 years is unequivocally due to man-made emissions of greenhouse gases and that these changes are expected to continue and intensify;
- Average global temperatures are expected to increase by 1.4 to 4.4°C by the end of the century;
- By 2100, global sea level is expected to increase by 0.42m (0.28-0.55m; SSP1-1.9) for the very low emissions scenario and 0.82m (0.63-1.01m; SSP5-8.5) for the very high emissions scenario by the end of the century;
- The contrast between areas of wet and dry regions is to become greater, those areas currently considered dry are expected to get drier while those areas considered wet are expected to get wetter;
- The intensity of extreme weather events, e.g. storms, is expected to increase.
Global warming projections - ICHEC
This video shows how global temperatures have warmed since 1900 and are projected to warm until 2100 simulated under the Shared Socioeconomic Pathways (SSPs); SSP1-2.6, SSP2-4.5, SSP3-7.0 & SSP5-8.5. Changes are with respect to the mean of the pre-industrial baseline period, 1850-1900. Red indicates temperatures higher than the average during the baseline period while blues indicate lower temperatures than the baseline average. There is a notable acceleration in these temperatures in the 1970s as greenhouse gas emissions from energy production increase worldwide (Source: Met Éireann and ICHEC).
Detailed explanation
International scientific evidence has shown that it is unequivocal that human influence has been the dominant cause of observed temperature increases since the mid-20th century. The Sixth Assessment Report of the IPCC (2021) states that continued emissions of greenhouse gases will cause further warming and changes in all components of the climate system and that limiting this climate change will require substantial and sustained reductions of greenhouse gas emissions.
Global warming of 1.5°C and 2°C will be exceeded during the 21st century unless deep reductions in CO2 and other greenhouse gas emissions occur in the coming decades.
Most aspects of climate change will persist for many centuries even if emissions of CO2 stopped. This is representative of a substantial commitment created by past, present and future emissions of CO2.
The IPCC Sixth Assessment Report details projections from a range of global climate models and indicates that significant impacts on world climate are likely to occur over the present century. Projections for the next few decades show spatial patterns of climate change similar to those projected for the later 21st century but with smaller magnitude. Natural variability will continue to play a role, particularly in the near term and at the regional scale, but by the mid-21st century the magnitude of projected changes will be substantially affected by levels of emissions over the coming decades.
Key Projected Climatic Changes
All projected changes are relative to the recent period 1995-2014 and are based on the findings of the IPCC Sixth Assessment Report.
- The global mean surface temperature for the period 2021-2040 is expected to increase by 0.35-1.05°C;
- Global temperatures are projected to increase by between 0.15-4.85°C by 2081 - 2100;
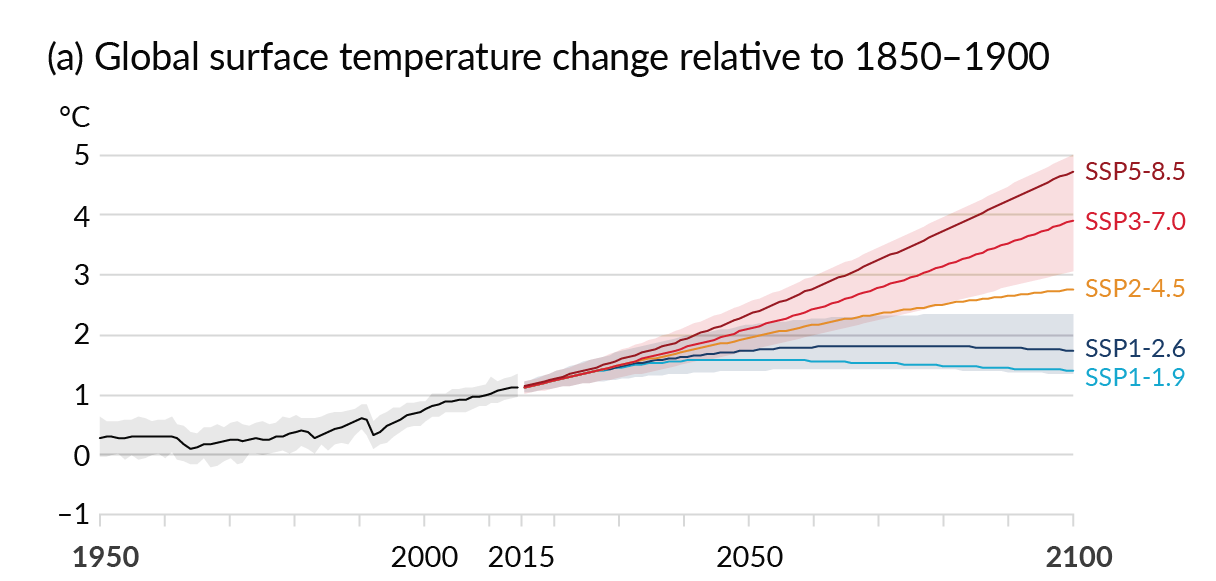
CMIP6 multi-model simulated time series from 1950 to 2100 for change in global annual mean surface temperature relative to 1995-2014. Time series of projections for each of the five SSPs and the very likely ranges are shown for scenarios SSP1-2.6 (blue) and SSP3-7.0 (red). Black (grey shading) is the modelled historical evolution using reconstructed forcings and constrained with observational data [source: IPCC, 2021].
- An increase in the occurrence of hot temperature extremes and fewer cold temperature extremes is virtually certain to occur. Occasional cold winters will continue to occur;
- The contrast in precipitation between wet and dry regions and between wet and dry seasons will increase, although there may be regional exceptions;
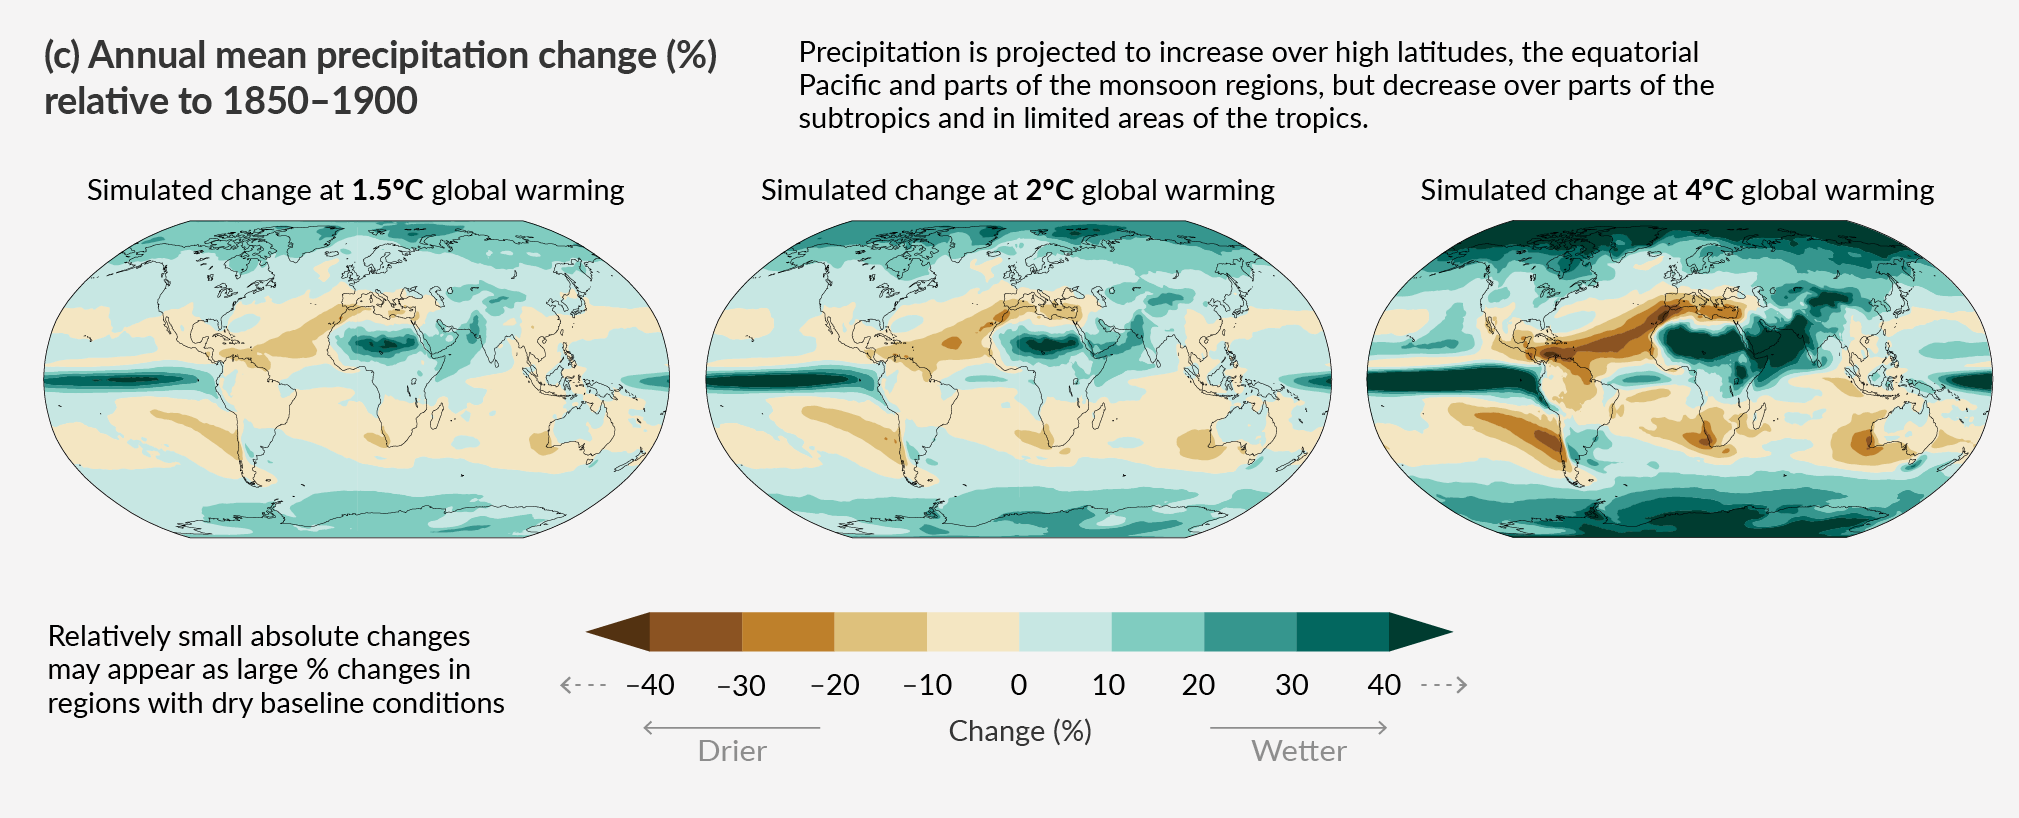
Maps of CMIP6 multi-model mean results for the global warming scenarios of 1.5°C, 2°C and 4°C for average percent change in annual mean precipitation. The global warming scenarios are relative to surface temperature 1850-1900 [source: IPCC, 2021].
- A widespread decrease in mountain glaciers is expected while snow cover in the Northern Hemisphere is also projected to contract and the upper layers of permafrost at high northern latitudes will decrease;
- The extent of sea ice in the Arctic is projected to decrease and at least one nearly ice-free Arctic Ocean in September by mid-century is likely across all models;
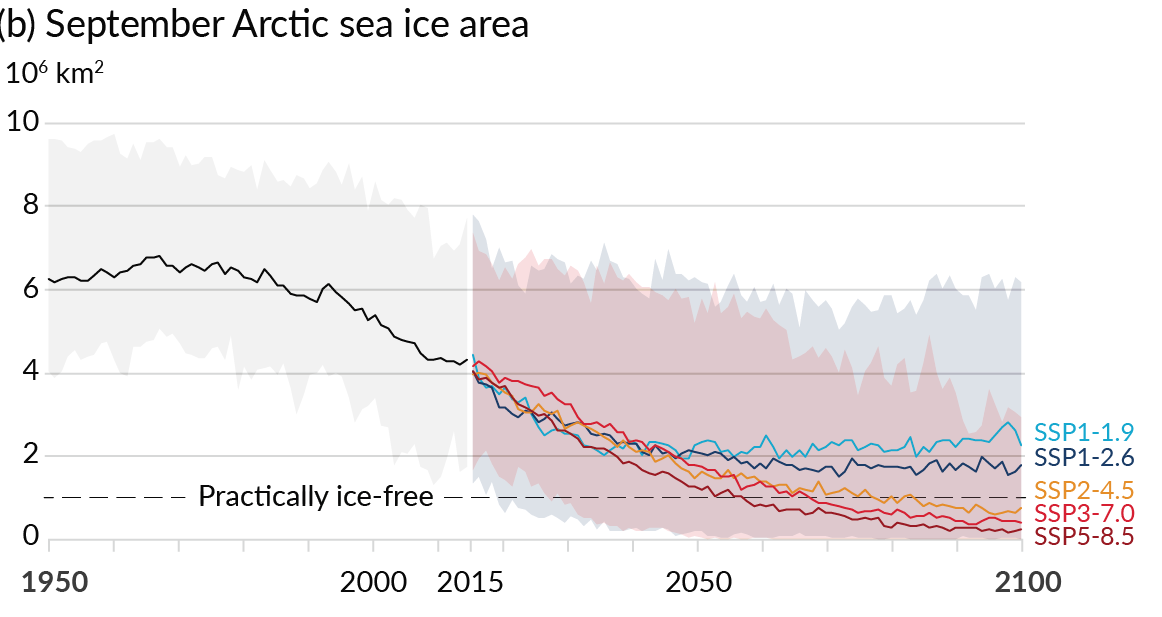
CMIP6 multi-model simulated time series from 1950 to 2100 for September sea ice area relative to 1995-2014. Time series of projections for each of the five SSPs and the very likely ranges are shown for scenarios SSP1-2.6 (blue) and SSP3-7.0 (red). Black (grey shading) is the modelled historical evolution using reconstructed forcings and constrained with observational data [source: IPCC, 2021].
- Globally, sea level is expected to rise by 0.42m (0.28-0.55m) for the very low emissions scenario and 0.82m (0.63-1.01m; SSP5-8.5) for the very high emissions scenario by the end of the century;
- Storm track locations are projected to shift pole-wards and the intensity of tropical cyclones is expected to increase;
- The Atlantic Meridional Overturning Circulation (AMOC), of which the Gulf Stream is a part, is likely to continue to weaken during the present century. However, an abrupt collapse of the AMOC during this period is very unlikely.
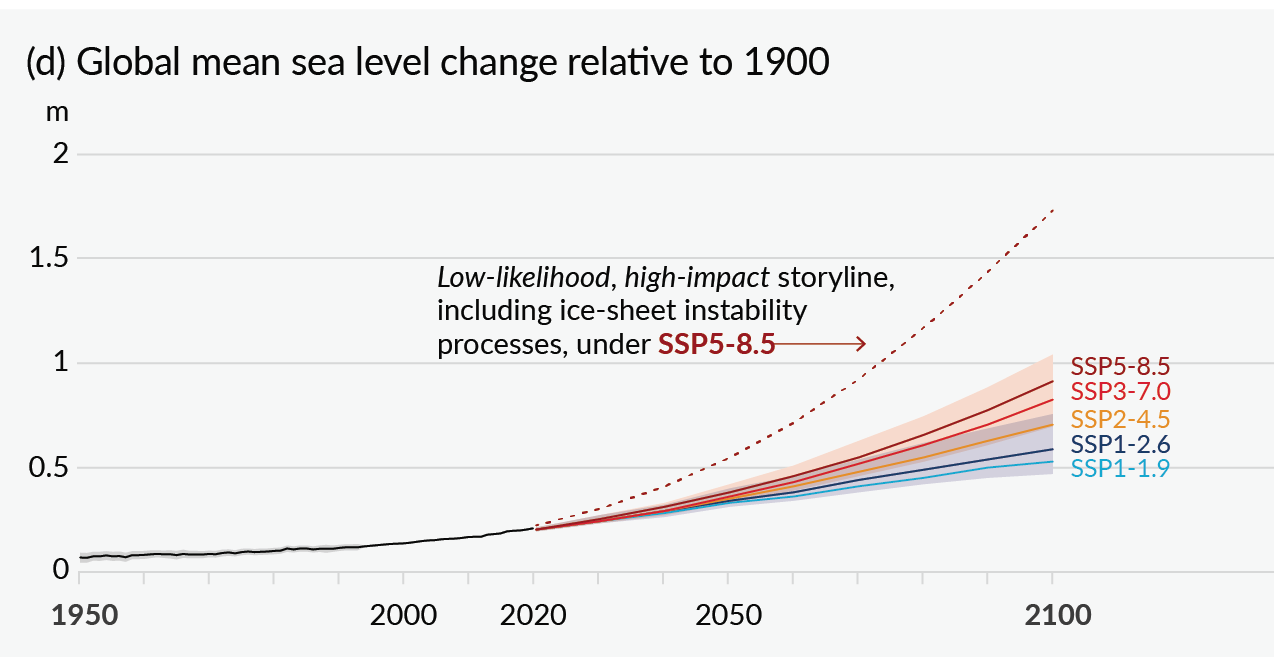
CMIP6 multi-model simulated time series from 1950 to 2100 for global mean sea level change relative to 1900. Time series of projections for each of the five SSPs and the very likely ranges are shown for scenarios SSP1-2.6 (blue) and SSP3-7.0 (red). Black (grey shading) is the modelled historical evolution using reconstructed forcings and constrained with observational data. A low-likelihood but high impact projection from SSP5-8.5 is included (dotted red line) to illustrate the potential for changes under ice-sheet instability [source: IPCC, 2021].
Resources
- A Report of Working Group I of the Intergovernmental Panel on Climate Change 2021: Summary for Policymakers: Based on contribution of IPCC Working Group I (AR6), this report describes progress in the understanding of the human and natural drivers of climate change, observed climate change, climate processes and attribution, and estimates of projected future climate change.
- A Report of Working Group I of the Intergovernmental Panel on Climate Change 2014: Summary for Policymakers: Based on contribution of IPCC Working Group I (AR5), this report describes progress in the understanding of the human and natural drivers of climate change, observed climate change, climate processes and attribution, and estimates of projected future climate change.
- Met Éireann Climate Change: Page outlining the role Met Éireann plays in measuring and project climate change in Ireland
- Copernicus Climate Projections: European resource for climate projections, metrics and enhanced datasets. Copernicus currently has a strong focus on providing quantitative information about the uncertainties in projected outcomes.