Evidence of climate change
Key information
Although the Earth's climate has changed throughout history, the last century has seen unprecedented changes and these changes have been attributed to increased atmospheric concentrations of GHGs. The impacts of these changes are already being felt across the world’s oceans, continents and atmosphere. Moreover, these changes are also being observed for Ireland where temperatures are increasing, spatial and temporal patterns of precipitation are changing and sea levels are rising.
The evidence of human induced climate change is clear and 97% of scientists agree that recent climate warming trends are due to human activities.
- Global temperature reconstructions show that the earth's climate has been warming since 1880. The majority of this warming has occurred since the 1970s with the 20 warmest years occurring since 1995 and with all 10 of the warmest years occurring since 2000;
- The Greenland and Antarctic ice sheets have decreased in mass while the extent and thickness of Arctic sea ice has declined rapidly over the last seven decades;
- Glaciers are retreating almost everywhere around the world, including in the Alps, Himalayas, Andes, Rockies, Alaska and Africa;
- Between the period 1901-2018, global sea level has risen by 0.2m. The rate of increase has moved from 1.9mm/year between 1961-2006 to 3.7mm/year between 2006-2018, with the rate continuing to increase annually;
- Temporal and spatial patterns of precipitation are changing;
- Changes in the frequency and intensity of many extreme weather events have been observed since the 1950s. Some of these changes have been linked to human influences and these include a decrease in the occurrence of cold temperature extremes, an increase in the occurrence of warm temperature extremes, rising sea levels and an increase in the occurrence of heavy precipitation events in a number of regions.
Detailed explanation
Global climate is changing, and this is especially the case since the onset of the industrial period and the rapid increase in levels of emission of greenhouse gases, CO2 in particular.
Reflecting global patterns of climate change, the last century has been a period of unprecedented climate change in Ireland and has seen, amongst others changes, increasing temperatures, changing patterns of precipitation and increasing sea levels. Projections indicate that over the coming century, these changes will continue and intensify.
Ireland's climate is changing in line with global trends and temperatures have increased nationally by 0.9°C over the past 120 years.
Find out more about climate change in Ireland.
Global climate change
The atmospheric concentrations of Greenhouse Gases (carbon dioxide, methane and nitrous oxide) have increased to levels unprecedented in the last 800,000 years. Since pre-industrial times, carbon dioxide concentrations have increased by almost 50%.

Monthly mean concentration of CO₂ at Mauna Loa Observatory, Hawaii (1958–2018), and Mace Head Atmospheric Research Station, Ireland (1992–2018) [source: CSRI, 2020].
Between 1850-1900 and 2011-2020, average global temperature has increased by 1.09°C. This temperature increase is demonstrated by the fact that each of the last four decades has been successively warmer at the Earth's surface than any preceding decade since 1850.
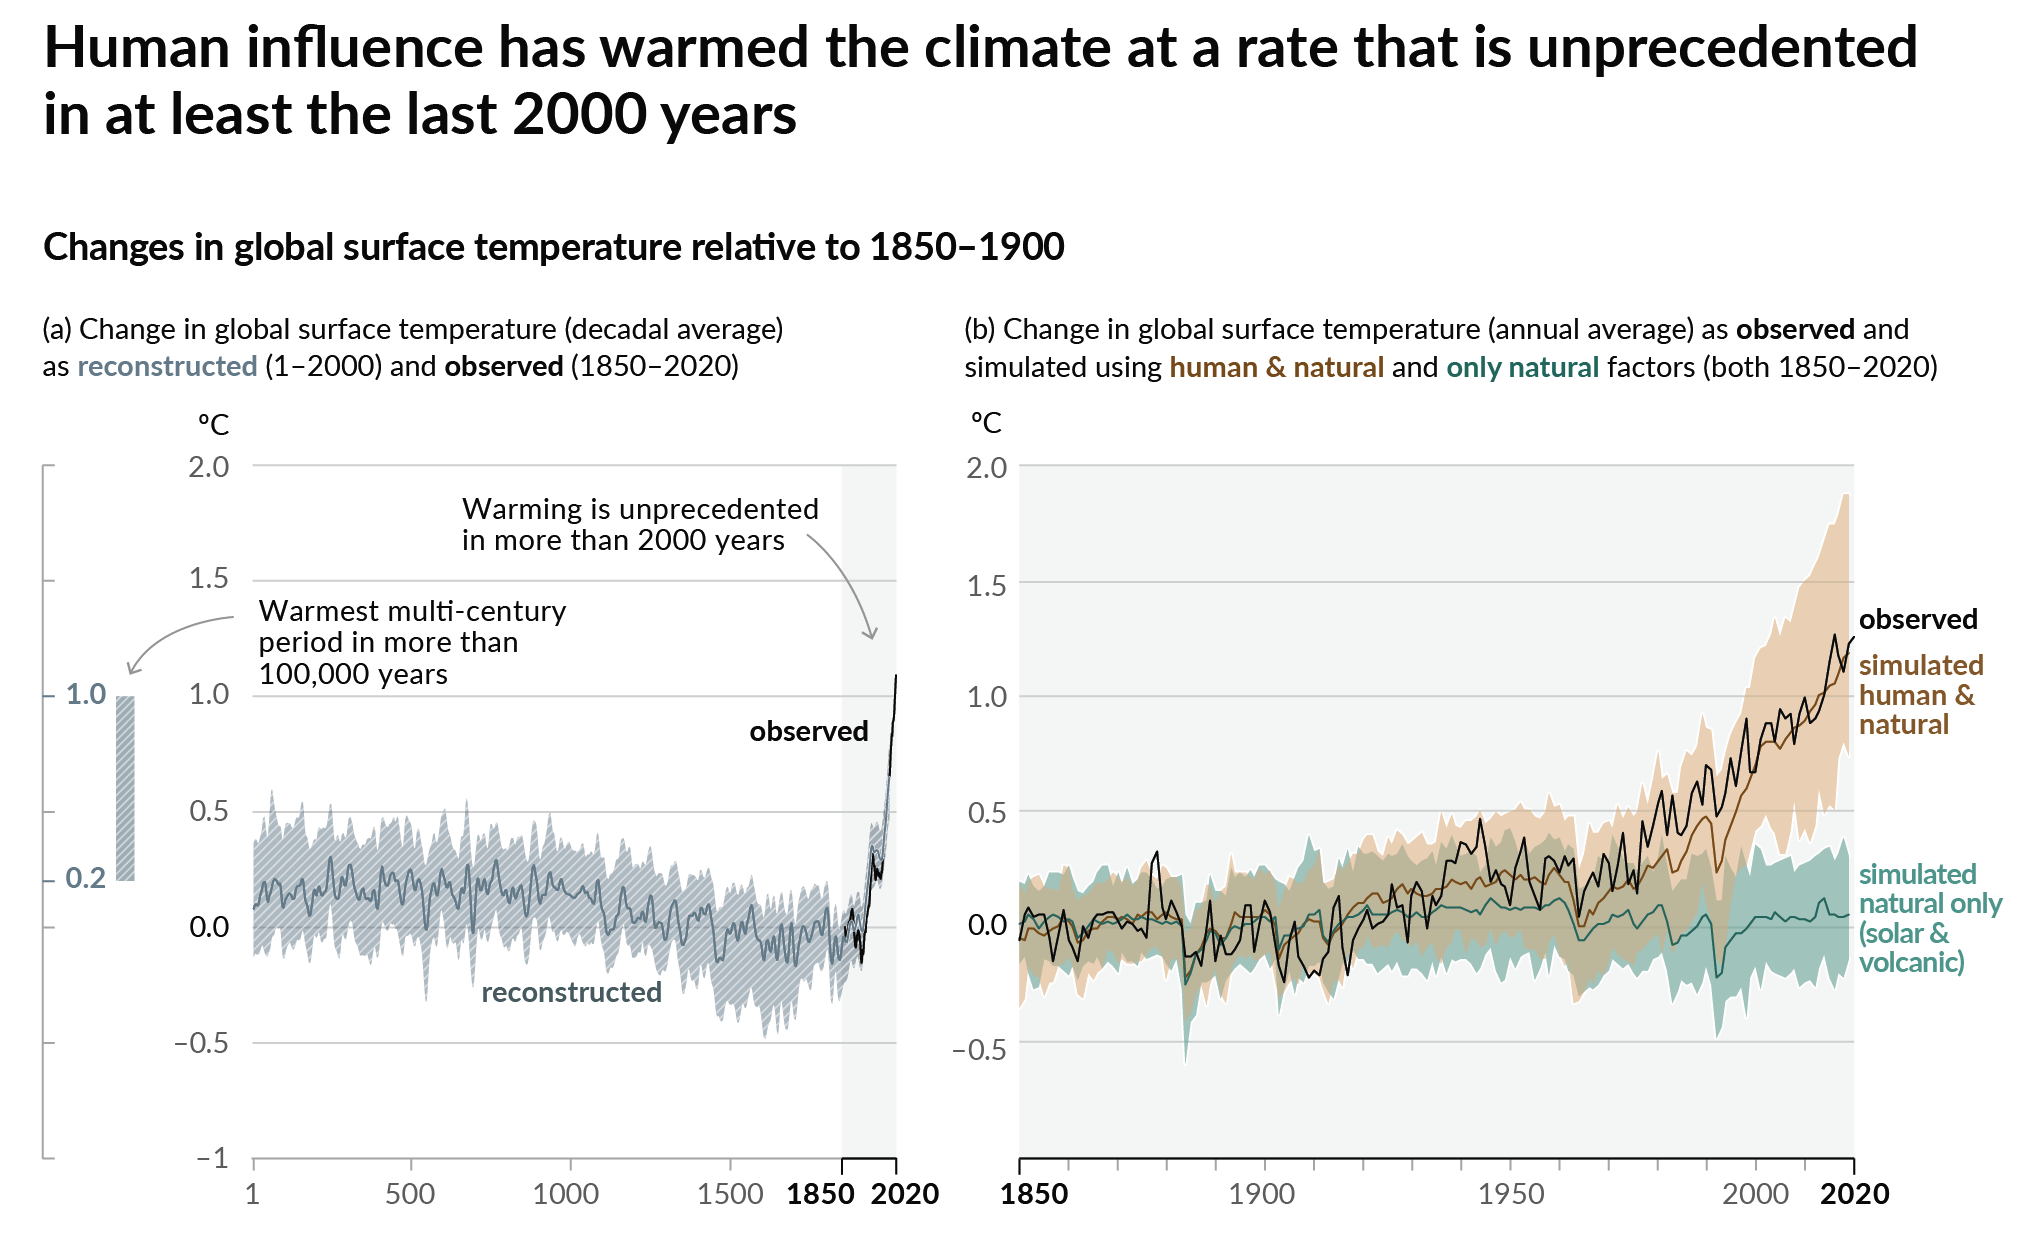
Changes in global surface temperature relative to 1850 - the left-hand graph showing reconstructed temperature over the past two millenia and observed change since 1850 and the right-hand graph showing the human-influenced warming since 1850 [source: IPCC, 2021].
Increasing temperatures have resulted in rising sea levels. After almost 2000 years of relatively little change in sea level, from 1901 to 2018, global sea level has risen by 0.2m.

Global mean sea level relative to the 1900–1905 mean of the longest running dataset, and with all datasets aligned to have the same value in 1993, the first year of satellite altimetry data. All time-series (coloured lines indicating different data sets) show annual values, and where assessed, uncertainties are indicated by coloured shading [source: IPCC, 2014].
As a result of increasing temperatures, the frequency and intensity of extreme weather events are increasing, heat waves are more recurrent while the number of cold days has decreased, and places that experience relatively high levels of precipitation are becoming even wetter.
Climate change in Ireland
The mean annual temperature for Ireland has experienced an overall increase of 0.9°C over the last 120 years with fifteen of the top 20 warmest years on record having occurred since 1990.
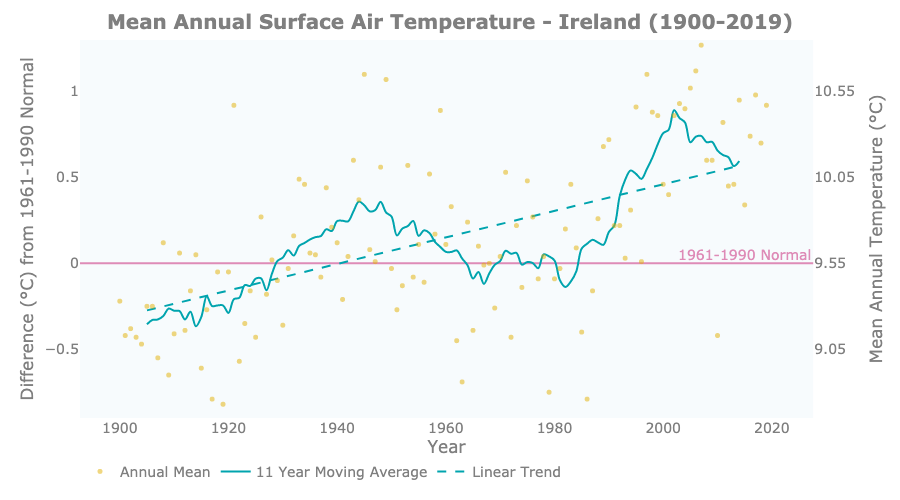
A time series graph of mean annual observed temperature for Ireland (1900-2019) (yellow dots) along with simple statistical fits to the data. The left-hand axis indicates anomalies (the difference between the mean annual temperature and the 1961-1990 normal or reference mean value) and the right-hand axis the mean annual temperature for the period. A simple linear trend line (blue dashed) has been fitted to the annual anomaly values [source: CSRI, 2020].
There has been a decrease in the number of frost days (temperatures below 0°C) and a shortening of the frost season duration. In contrast, there has been an increase in the number of warm days (temperature > 20°C). This is in line with trends evident for the rest of Western Europe.
For Ireland, satellite observations indicate that sea levels around Ireland have increased by approximately 2-3 mm per year since the 1990s.

Sea level trends (mm/year) during the satellite altimetry era. The data have not been adjusted for glacial isostatic adjustment (the movement of land in response to historic glaciers) [Source: Copernicus Climate Change Service (C3S)/Copernicus Marine Environment Monitoring Service (CMEMS)].
For Ireland, when compared with an annual average rainfall of 1186mm in the period 1961-1990, the thirty-year period 1990-2019 shows a 70mm or almost 7% increase in rainfall. The last decade from 2006 - 2015 has been the wettest period in the period 1711- 2016 and there is evidence of an increasing trend in winter rainfall and a decreasing trend in summer rainfall.

A time-series graph (1941-2019) of the annual average rainfall totals (right-hand axis) and the annual anomalies, or differences, from the 1961–1990 normal (left-hand axis). A moving average for periods of 11 years is also shown (blue line). Since the 1980s an increasing trend can be observed in the 11-year moving average [source: CSRI, 2020].
Resources
- American Meteorological Society - State of the Climate 2015
- An international, peer-reviewed publication released each summer, the State of the Climate is the authoritative annual summary of the global climate published as a supplement to the Bulletin of the American Meteorological Society. The report, compiled by NOAA’s Center for Weather and Climate at the National Centers for Environmental Information is based on contributions from scientists from around the world. It provides a detailed update on global climate indicators, notable weather events, and other data collected by environmental monitoring stations and instruments located on land, water, ice, and in space.
- A Report of Working Group I of the Intergovernmental Panel on Climate Change: Summary for Policymakers
- Based on contribution of IPCC Working Group I (AR6), this report describes progress in the understanding of the human and natural drivers of climate change, observed climate change, climate processes and attribution, and estimates of projected future climate change.
- NASA - Global Climate Change: Vital Signs of the Planet
- On this page, NASA presents global evidence of climate change.
- The Status of Ireland's Climate, 2020
- Produced by the EPA, this report brings together observational information and data for 50 climate variables and highlights changes and trends in aspects of Ireland's climate across the atmospheric, oceanic and terrestrial domains.
- Key Meteorological Indicators of Climate Change in Ireland
- Based on existing observational data, this report details a number of potential indicators for climate change in Ireland at a regional and local level. These changes are examined in the context of exiting observational evidence of global climate change.